
If you opened your risk register right now, could you tell which risks need attention first?
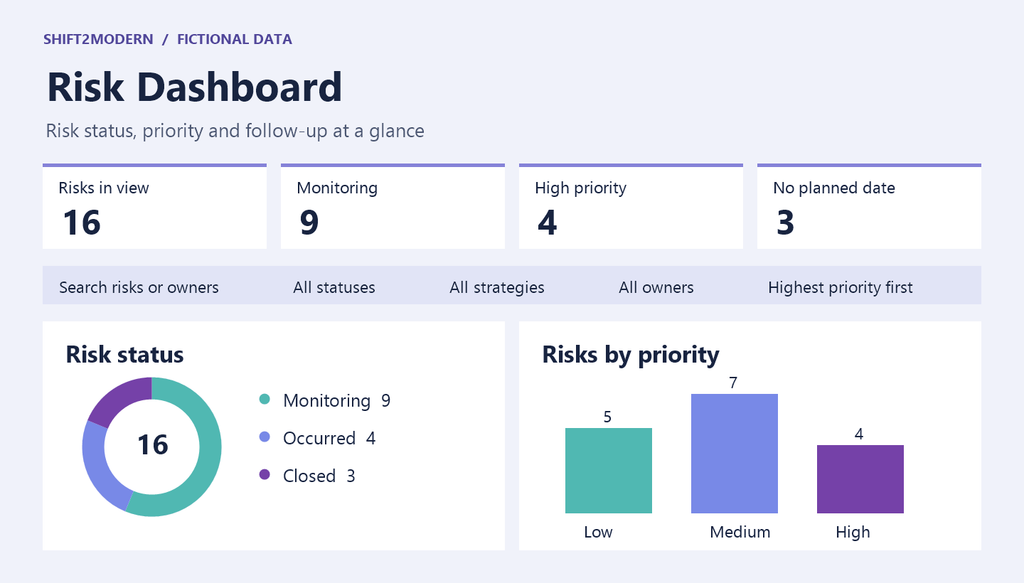
I used Copilot in SharePoint to turn a risk assessment list into a live HTML dashboard. It stays connected to the list and shows risk status, priority, and which items still need a follow-up date.
I then asked Copilot to add a Chart.js bubble chart. Plotting probability against impact made it easier to spot risks that are both likely and consequential. Bubble size shows the priority score, and color shows the risk level.
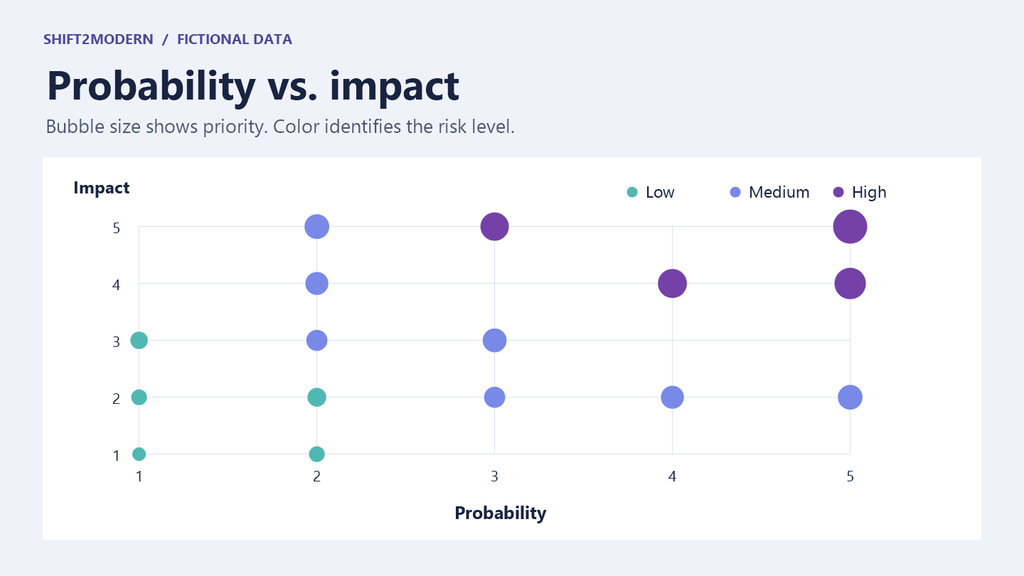
In a risk review, I’d start in the upper-right of the chart, where probability and impact are both high. In this example, the risk rated 5 out of 5 on both axes is the first one I’d discuss. From there, I’d filter by owner or status and check who’s responsible for the response and when it’s due.
The dashboard also shows three risks without a planned follow-up date. Before the review ends, I’d agree with the owners on when to check each one again.
Thanks to Daniel Anderson and Zach Rosenfield for inspiring me to try this.
The images use fictional data.