
A completion percentage becomes more useful when you compare it with the timeline. Here is the daily date-refresh pattern behind that comparison in Central Point.
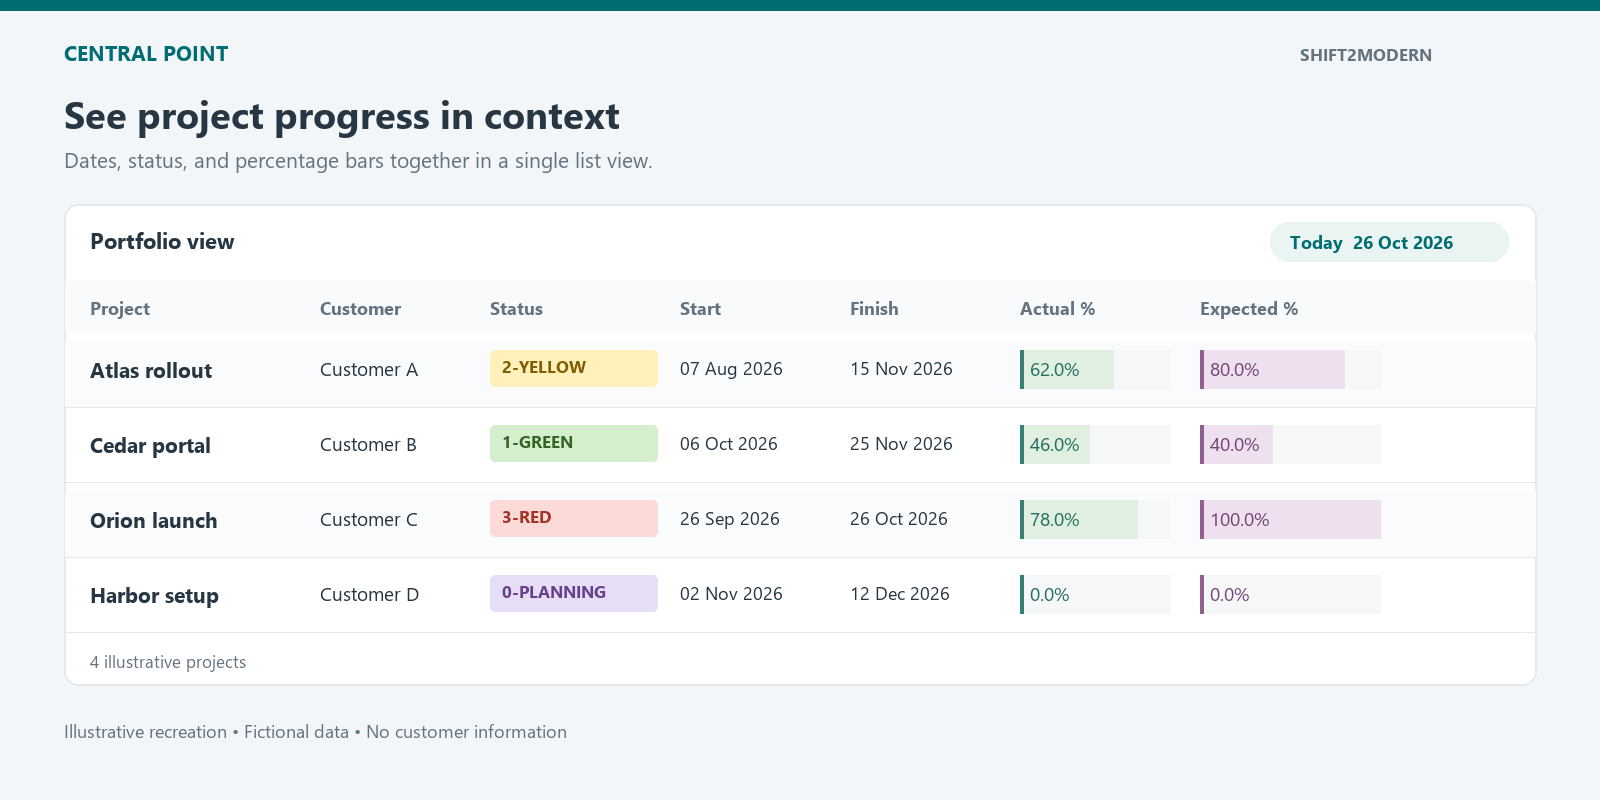
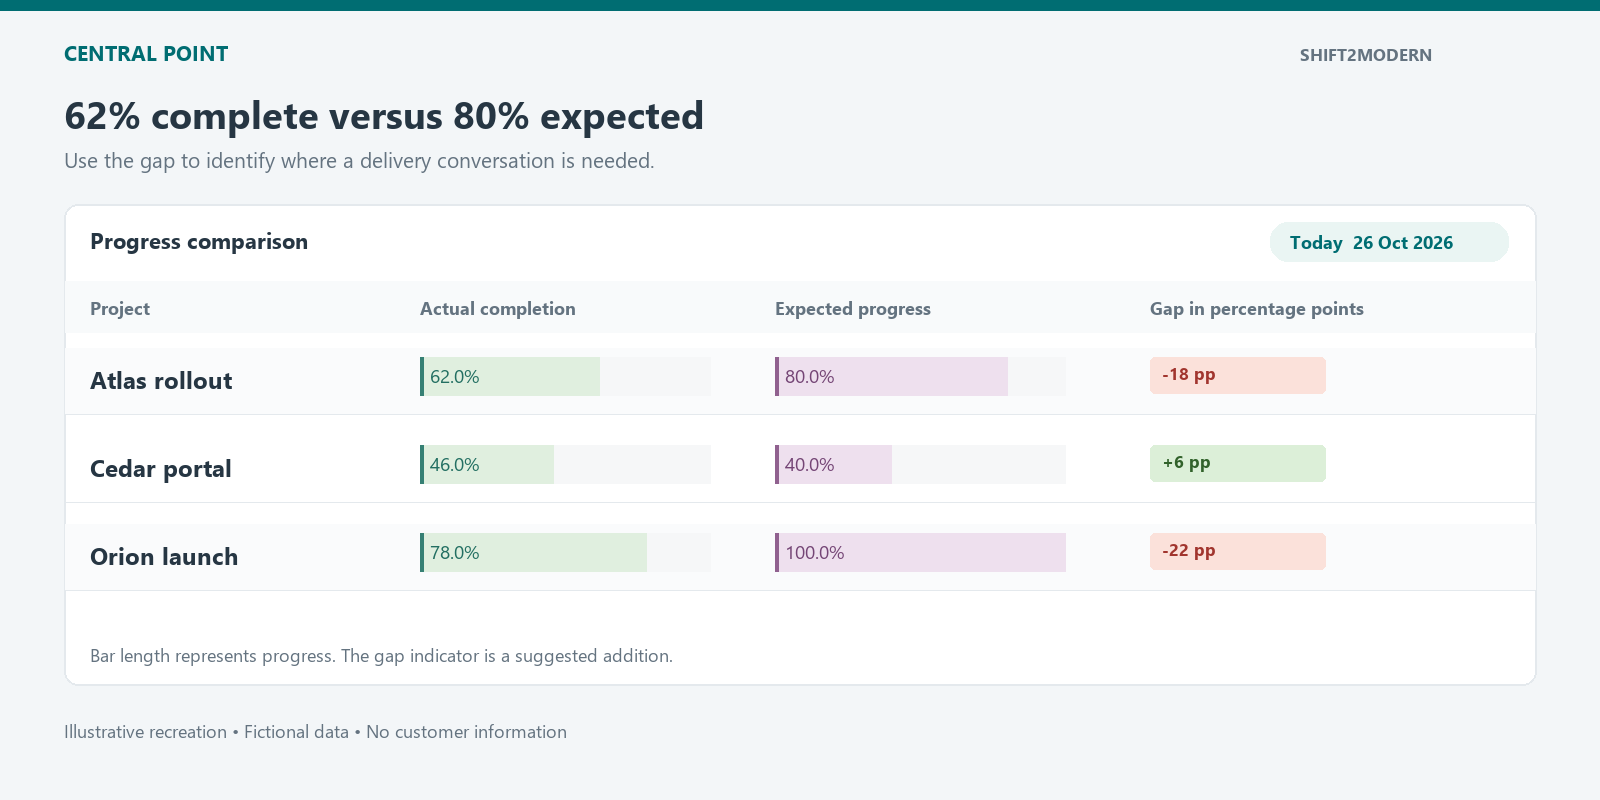
Imagine a project reporting 62% complete. That number tells you something about the work delivered. It does not tell you whether the project is progressing at the pace the plan requires.
If 80% of the planned duration has elapsed, the gap is −18 percentage points. That deserves a conversation about the remaining work, dependencies, and delivery dates.
For this example, I call the solution Central Point. It uses Microsoft Lists and Power Automate to make this comparison visible. A small scheduled flow keeps a stored Today date current. Calculated columns use it to work out expected progress. This article focuses on refreshing the date and calculating expected progress. I will cover retrieving actual completion from Planner in a separate article.
What expected progress actually measures
Expected progress = (Today − Start date) / (Finish date − Start date)
Progress gap = Actual progress − Expected progress
This is a linear calendar-time reference: it assumes progress should accumulate evenly between the chosen dates. It is useful for screening a portfolio and deciding where to ask questions. It does not account for task weighting, working calendars, or the critical path.
It also differs from Earned Value. Earned Value measures the budgeted value of work performed. Dates alone produce a time-based expected-progress indicator; they do not establish EV or a formal EVM schedule variance.
| Measure | Value |
|---|---|
| Elapsed duration | 80 days |
| Expected progress | 80% |
| Actual progress | 62% |
| Progress gap | −18 percentage points |
The gap is a prompt to investigate. A project with substantial testing or deployment work near the end may follow a different planned curve. Before interpreting the result, agree how actual completion is measured and which dates define the comparison.
Use the licenses you already have
If you already have SharePoint and Microsoft Lists through a Microsoft 365 or Office 365 plan that includes Power Automate rights for standard connectors, the solution shown here requires no additional license purchase. The scheduled Today refresh uses the standard SharePoint connector and built-in actions; it does not require Power Automate Premium.
This applies to the date-refresh and expected-progress solution in this article. Any future Planner or Dataverse integration needs its own licensing check.
Why a flow needs to refresh Today
The list contains a real Date and Time column called Today, configured to display the date only. Power Automate updates that field on each selected item.
This is different from putting TODAY() into a calculated-column formula. Microsoft documents that TODAY is unsupported in calculated columns, although it is supported in column defaults. A default supplies an initial value; it is not a daily refresh mechanism.
The Today flow in Central Point
The flow Refresh Today (the name used in this example) uses six steps:
- Recurrence: every day at 1:00 a.m., with the Brasília time zone selected.
- Initialize variable: create the String variable
var_Today. - Get items: retrieve projects from the Central Point list.
- List Name: a Compose action holds the destination list name.
- Apply to each: process the returned list items.
- Update item: use each item’s ID and write only the
Todayproperty in the supplied item object.
The current date expression is:
formatDateTime(utcNow(),'MM-dd-yyyy')
The flow retrieves items with pagination enabled and a threshold of 2,000. That setting should match the portfolio’s size and be monitored as it grows. Its most recent inspected run completed successfully, but a successful run still needs checks for coverage and data quality.
A clearer date expression for a reusable example
For a new implementation, I would make the reporting time zone explicit and use an ISO date format:
convertTimeZone(utcNow(),'UTC','E. South America Standard Time','yyyy-MM-dd')
This is a proposed improvement, not the expression currently saved in the flow. At the existing 1:00 a.m. Brasília schedule, UTC and Brasília fall on the same calendar date. Making the conversion explicit protects the intended date if the schedule changes or someone runs the flow near a UTC date boundary. Verify how the saved date reads back under your SharePoint regional settings.
The columns behind the calculation
The operational calculation uses a date-to-number helper chain. These are the formulas currently configured in the list:
| Calculated column | Formula |
|---|---|
| Today in Number | =Today |
| OPS Start Estimated Date in Number | =[OPS Start Date] |
| OPS Finish Estimated Date in Number | =[OPS Finish Date] |
| OPS Effort in Days | =[OPS Finish Estimated Date in Number]-[OPS Start Estimated Date in Number] |
The final % OPS EP column returns a Number displayed as a percentage:
=IFERROR(([Today in Number]-[OPS Start Estimated Date in Number])/[OPS Effort in Days],0)
The column called “Effort in Days” is actually elapsed calendar duration. It does not measure person-days or working-day effort. Keeping that distinction clear prevents misleading comparisons.
Handle invalid dates separately from 0% progress
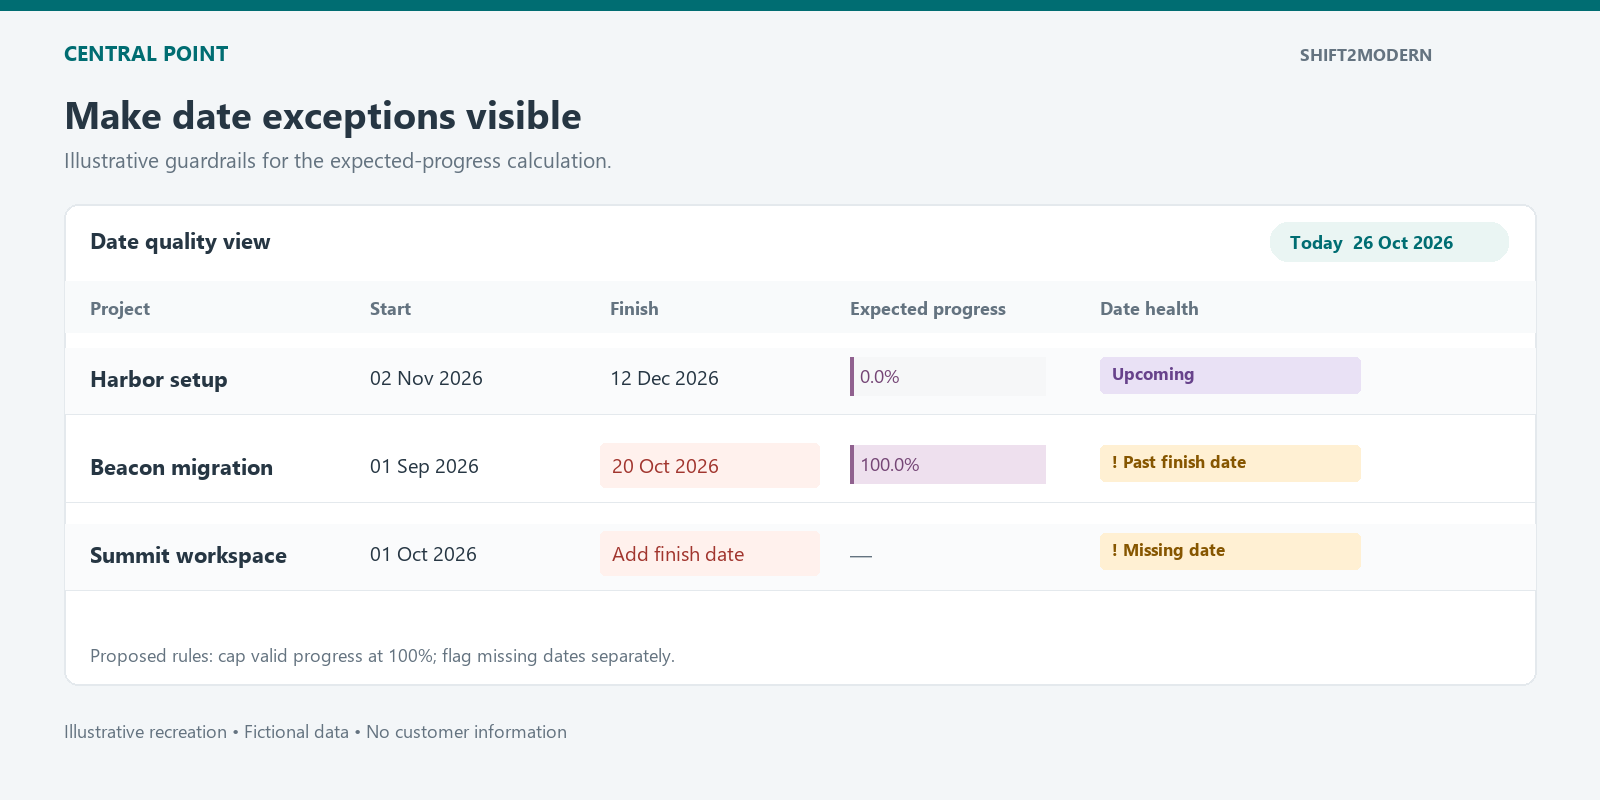
The current formula can return negative progress before the start and more than 100% after the finish. It also turns calculation errors into 0. Those behaviors need explicit decisions before reusing the pattern.
For a beginner-facing implementation, my preferred rules are: show no progress result when dates are missing or finish is not after start; otherwise limit expected progress to 0–100%. Track overdue days separately, so the capped progress value does not hide lateness.
Missing dates or Finish ≤ Start → flag the dates for review
Today ≤ Start                  → 0%
Today ≥ Finish                 → 100%
Otherwise                      → (Today − Start) / (Finish − Start)
These are proposed rules. Validate them in a test list before changing an established report. A same-day milestone needs its own policy because its duration is zero. Also choose whether your reporting convention represents the start or end of a day.
What I would check before rolling this out
- Exact status values: use the list’s current labels in the Get items filter. Old labels can silently include projects you meant to exclude.
- Freshness: display the reporting date and the last successful project-data refresh. New dates with stale actual completion can create a misleading gap.
- Coverage: check pagination and confirm every eligible project was updated.
- Update side effects: date refreshes can affect item versions, Modified metadata, and flows triggered by item changes.
- Boundary cases: test missing dates, future starts, same-day milestones, reversed dates, overdue work, and completed projects.
The automation supports a more specific portfolio discussion: which projects need attention, which dates need correction, and what must happen next to protect delivery. The indicator is useful when those follow-up decisions are clear.
Build this capability in your PMO
Want your team to build and maintain automations like this? Contact me about practical Power Automate training, or consulting hours to review your project data, formulas, and flow design.